gputaskman: See What Is Eating Your VRAM
- gputaskman
- GPU
- open source
Seeing a process name beside a GPU-memory figure is useful. Working out whether that memory holds model weights, a growing context window or desktop buffers is another question. Task Manager and nvidia-smi already provide per-process data on supported configurations; gputaskman adds runtime and model identification, explanations and estimated memory breakdowns in a free, open-source terminal interface.
An htop for the inside of the GPU
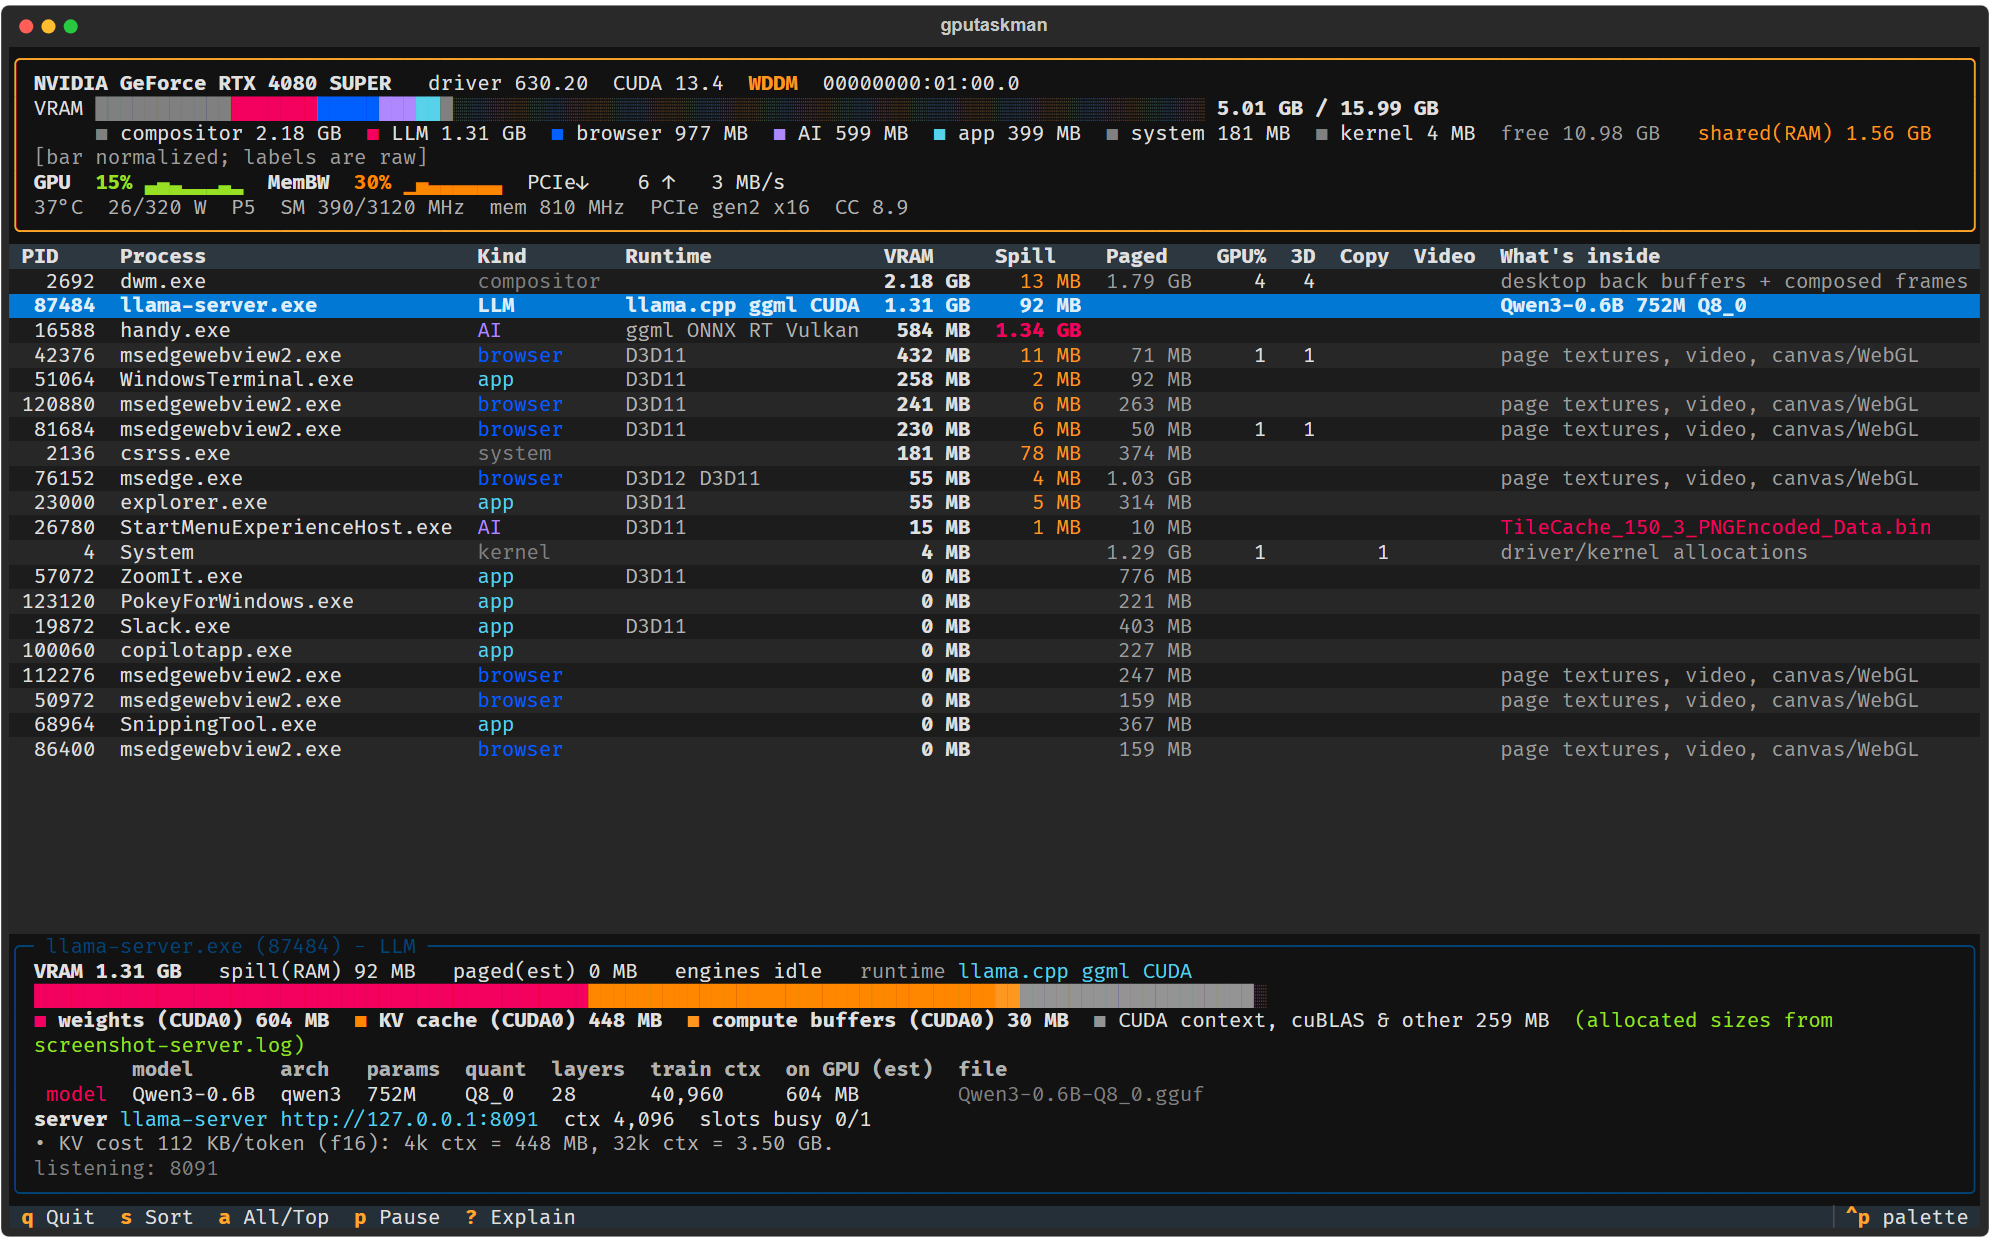
The project describes itself as an htop for what is inside your GPU, not just how full it is. The terminal interface shows device-level telemetry (VRAM, GPU load, temperature, power, clocks, PCIe traffic, with history charts) and, below it, a per-process table: how much GPU memory each process holds, how much sits in GPU-accessible system RAM, and which engines (3D, copy, video) it keeps busy.
Where it goes further than a generic monitor is workload identification. gputaskman detects runtimes such as CUDA, Vulkan, Direct3D, ggml and ONNX Runtime, and a model inspector tries to name the actual model a process holds, with architecture, quantization and layer count. For llama.cpp, Ollama and LM Studio workloads it can break a model's memory into weights, KV cache and compute buffers, and read available local-server hints like context size and throughput. That is conditional on the runtime and evidence it can inspect, not a guarantee for every model process. For anyone running local models, that answers the practical question of whether the 8 GB that disappeared went into the model itself or its context window.
Project screenshot with a captured local sample, not our benchmark. Scott Hanselman / gputaskman, MIT.
Measured, inferred, or unknown, and labeled as such
The useful part of gputaskman's documentation is that it explains where its numbers come from. The README states plainly: available OS and driver counters are measurements; classifications and GGUF-derived breakdowns are estimates. Some device figures, including Intel memory totals, are estimates too. The distinction carries through the interface. Unavailable counters show as N/A or null rather than a misleading zero. The "paged" column is estimated non-residency, not proof of eviction or disk paging. Process visibility also depends on permissions and exposed counters; some details require elevation.
Platform differences get the same treatment. On native Linux, per-process figures come from NVML or the kernel's DRM interfaces. Under WSL, Windows owns the GPU and Linux cannot see its own processes' VRAM directly, so gputaskman matches Windows-side counters to Linux processes and marks each row as matched or guessed. On Apple Silicon Macs, where the GPU shares one memory pool with the CPU, the tool reports what macOS exposes and says so. The built-in help screen explains these limits inside the app itself.
This matters because the honest posture has a cost the documentation also admits: some configurations are simply not validated yet. Multi-GPU Windows setups, newer AMD attribution rules, and Intel's xe driver are all flagged as covered by unit tests but not proven on hardware. The project's live checks are single machines with named GPUs, not benchmarks, and the README says as much.
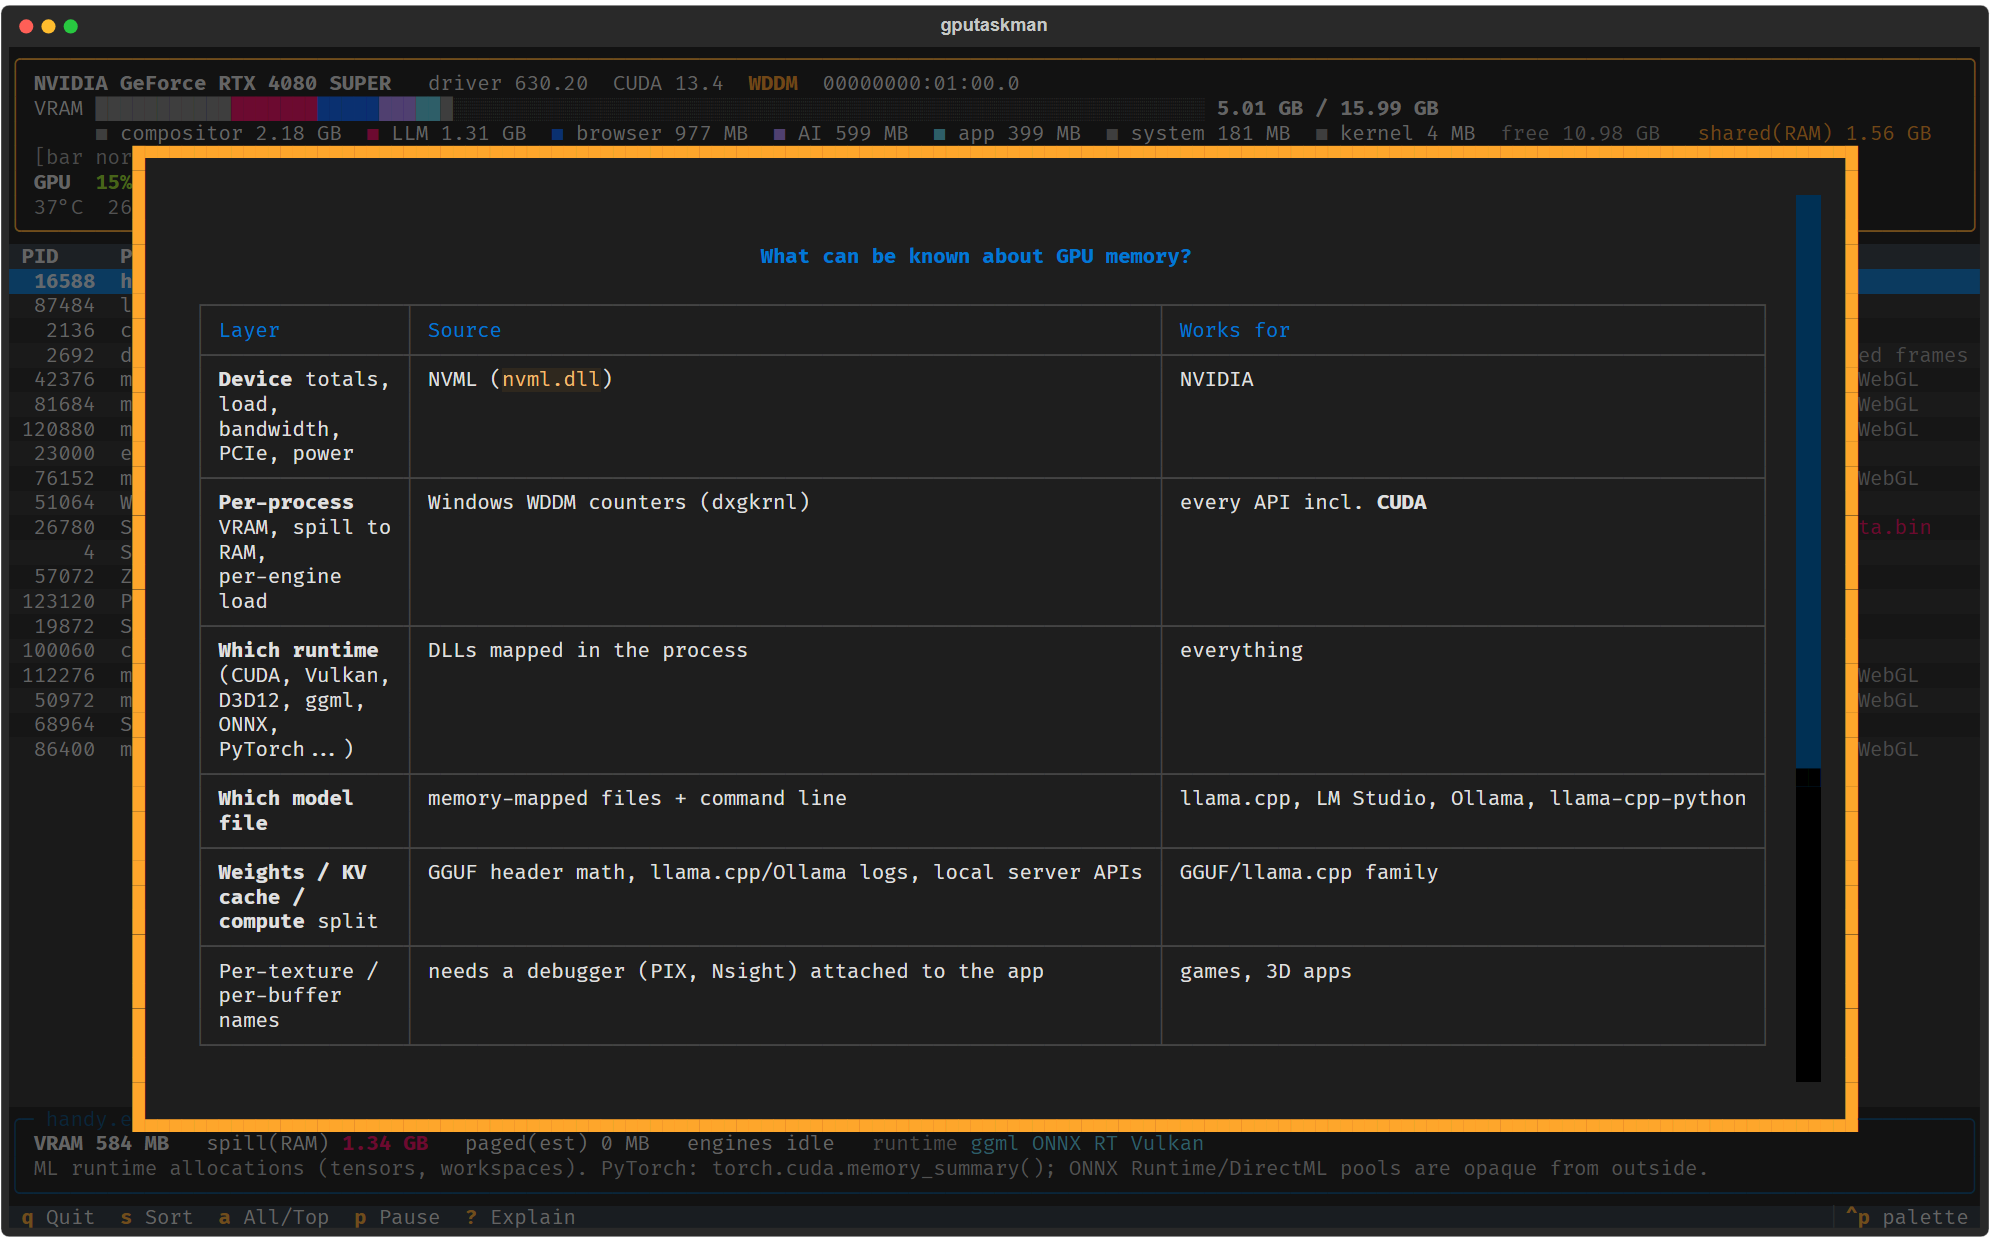
The built-in help distinguishes counters, model inference and debugger-only information. Project capture, Scott Hanselman / gputaskman, MIT.
Getting it
There are two routes. From PyPI, with Python 3.11 or newer: uv tool install gputaskman, or pipx install gputaskman, then run gputaskman (or the shorter gtm). For Windows without Python, the Releases page publishes portable ZIPs for x64 and ARM64, plus tarballs for Linux x64 and ARM64. The portable builds need no Python, CUDA Toolkit or admin session, just a supported GPU with a current driver. Builds are currently unsigned, so Windows SmartScreen may warn; each archive has a published SHA-256 file for verification. The project also documents Apple Silicon Macs, but provides no portable macOS build. Windows and Linux are the focus here.
The tool is a week old at the time of writing: the repository appeared on November 3, 2026, published by Scott Hanselman, and has already seen a rapid run of releases, with v0.3.5 out on November 10. It is MIT-licensed and free of charge. The README calls it early, experimental software, and that is the right expectation to bring: rapid fixes, some rough edges, and an unusually explicit account of what each number means.
This article is a discovery based on the project's README, release data and PyPI listing. We have not run gputaskman on our own hardware; every capability described here is the project's own account, and the measurements quoted in its documentation are single-machine checks, not guarantees. Readers who want a GPU monitor that explains its own uncertainty will find the full detail in the sources below, and the download facts in our gputaskman software entry.
Sources
Screenshots: Copyright (c) 2026 Scott Hanselman, from the gputaskman repository, unmodified, under its MIT license. The project capture script freezes real local samples and removes command lines and full paths for publication.