homelab-diagram: A Homelab Map That Starts in YAML
- homelab
Most homelab documentation starts with good intentions and ends as three stale notes, a spreadsheet nobody opens, and one diagram from two routers ago. The awkward part is not collecting the facts. It is keeping the picture in sync with them.
homelab-diagram attacks that problem from the data side. It is a free, open-source (MIT) Python script that reads a YAML inventory and draws a large network diagram as SVG, with PNG export through rsvg-convert. The style is aimed at the detailed network maps people post on r/homelab: switches, VLANs, link speeds, servers, containers, exposed services and a legend.
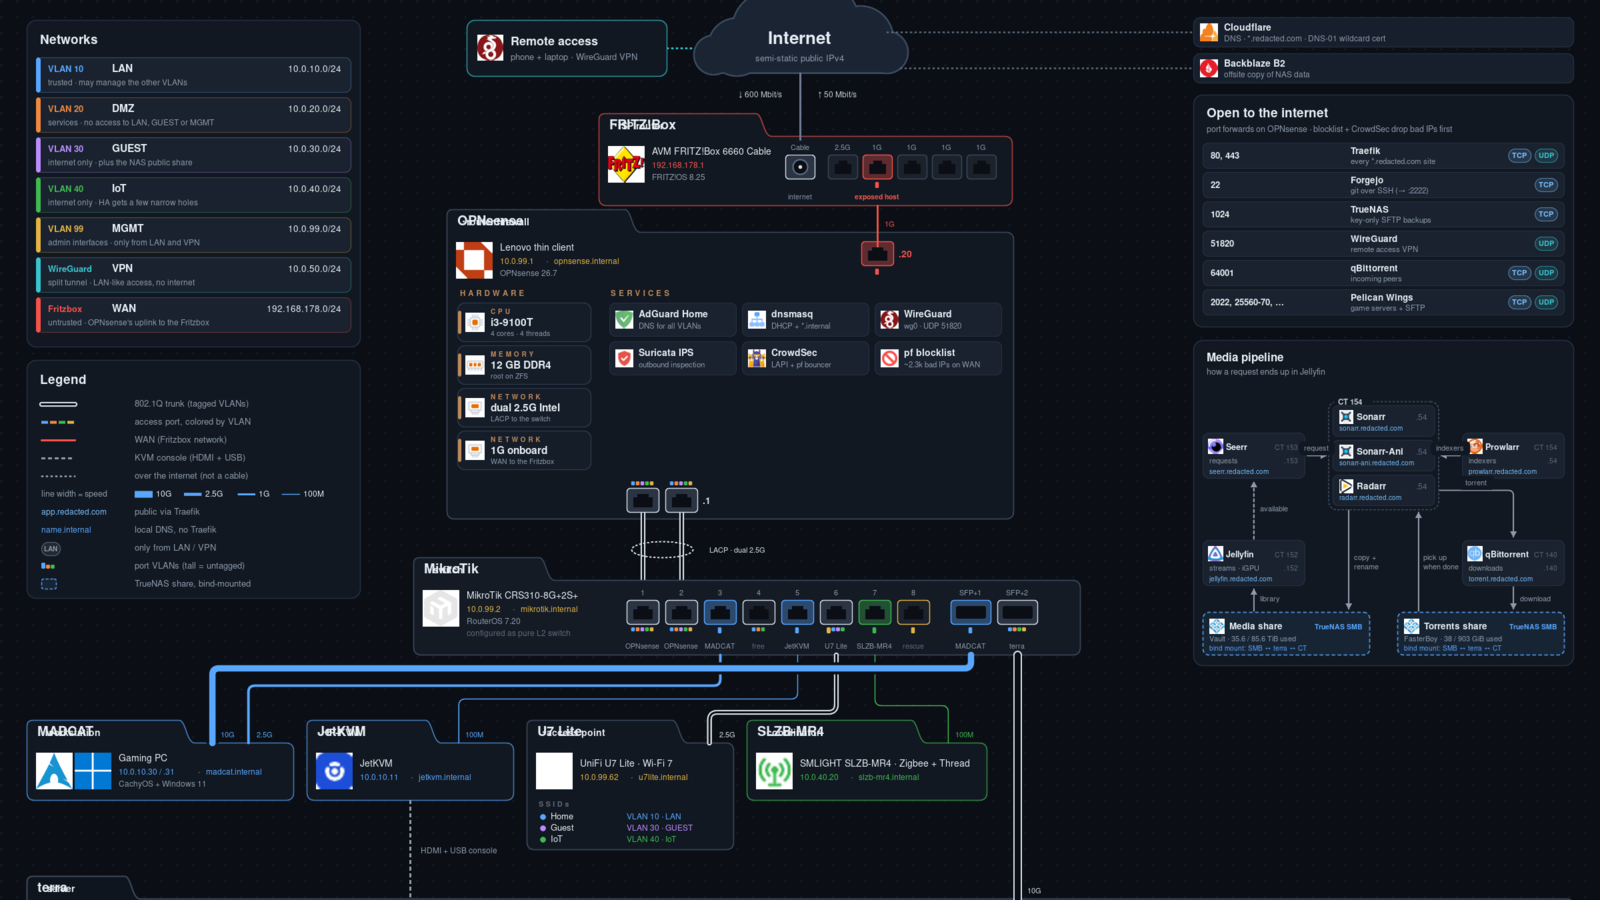
I tried it with the repository's own sample inventory in a fresh Linux test directory on November 14, 2026. After fetching the optional service icons, the script generated a redacted 2400 by 2326 pixel SVG from the sample data. The README's PNG step expects rsvg-convert; that converter was not available in this test environment, so I converted the finished SVG separately with ImageMagick for inspection. That is an environment note, not a defect in the project.
A picture generated from facts
The useful idea is simple: inventory.yaml holds the networks, machines, switch ports, VLANs, containers, storage pools and port forwards. build.py turns that inventory into the visual map. Cable width represents negotiated link speed, trunk lines are visually distinct, and VLAN tags use colored bars. The sample output also includes a networks table, a legend, an "open to the internet" panel and a media-pipeline explainer.
That makes the project more interesting than a generic drawing app for a very specific job. If your lab documentation already lives in text, changing the YAML and rendering again is easier than moving boxes around by hand. It also encourages a safer sharing habit: by default, the script replaces the configured domain with redacted.com and uses generic SSID names. A separate --unredacted mode renders the private version.
The important caveat
This is not a finished, general-purpose diagram generator. The developer says that plainly in the README: the content comes from YAML, but the layout is hand-placed in build.py for one particular network. If your switch has a different number of ports, your server card needs another column, or your lab simply is not shaped like the sample, you should expect to edit coordinates in the Python code.
That caveat changes who should try it. If you want a polished app where you paste a list and get a perfect map, this is not that. If you are comfortable editing Python and want a strong starting point for a good-looking homelab diagram, it is much more appealing.
What the sample run showed
The sample render is dense and mostly readable, with a few overlapping labels in places. The internet path runs through the ISP router and firewall into the core switch. Device cards carry model, address, hostname and operating system. A larger server section breaks out hardware, storage, virtual machines and grouped containers. The result looks closer to a hand-tuned poster than an automatic chart.
The repository does not include the third-party service icons. A separate script fetched 63 icon files from the homarr-labs/dashboard-icons project during this test. The code and the author's small glyph icons are MIT-licensed; the downloaded service logos remain the property of their respective projects.
The code was also written with Claude, and the author says so openly. That is not a reason to avoid the project, but it fits the practical reality: this is a personal script published as a reusable starting point, not a long-established product with releases, packages or a support process.
Who should try it
homelab-diagram makes sense for someone who already keeps homelab facts in text and wants those facts to produce a shareable map. It is also a good base if you use an AI coding assistant: the repository includes a CLAUDE.md file that explains the structure and the adaptation workflow.
Skip it if you want automatic layout, a desktop interface, numbered releases, or a tool you can recommend to a non-technical friend. For everyone else, clone it, render the sample first, then decide whether your network is close enough to adapt without fighting the coordinates.
Download details: homelab-diagram software page
Image credit: Freewares test capture of the redacted sample diagram generated by homelab-diagram.
Sources
- Project repository and README: https://github.com/Goblinmine/homelab-diagram
- Service icon source: https://github.com/homarr-labs/dashboard-icons